Did you know that when it comes to social media metrics, there are hundreds you could be analyzing? But the real question is, do you know where to find them and are they all necessary for your business? In this post, we’re going to look at the metrics you can gather from the top social networks and which ones matter most for your business.
Sprout features mentioned in this article:
- Facebook analytics
- Twitter analytics
- Twitter keyword report
- Instagram management
- Instagram analytics
- LinkedIn company pages report
- Social media analytics dashboard
What Are Social Media Metrics?
Social media metrics are data and statistics that give you insights into your social media marketing performance.
While some social media marketing metrics are universal, there are also platform specific metrics you need to learn. Plus, some data is calculated differently depending on the platform and social media metrics tools you’re using.
But don’t worry, we have you covered. We’re going to break down all of the social media metrics you need to know:
Official Social Media Metrics
First, let’s look at the metrics you can get directly from the top social networks. Here’s how you find them and what you can learn from them.
Facebook Insights Metrics
Facebook offers the most comprehensive metrics for business pages. You can start by going to the Platform Insights page to see a list of all of your Facebook Pages currently tracking metrics.
When you click on the Page you want to analyze, you will be taken to the Facebook insights report for that specific Page. Here, you will find an overview of your most important metrics, followed by detailed sections on your Likes, reach, visits, posts and people. We’ll break down the important sections of Facebook Insights below.
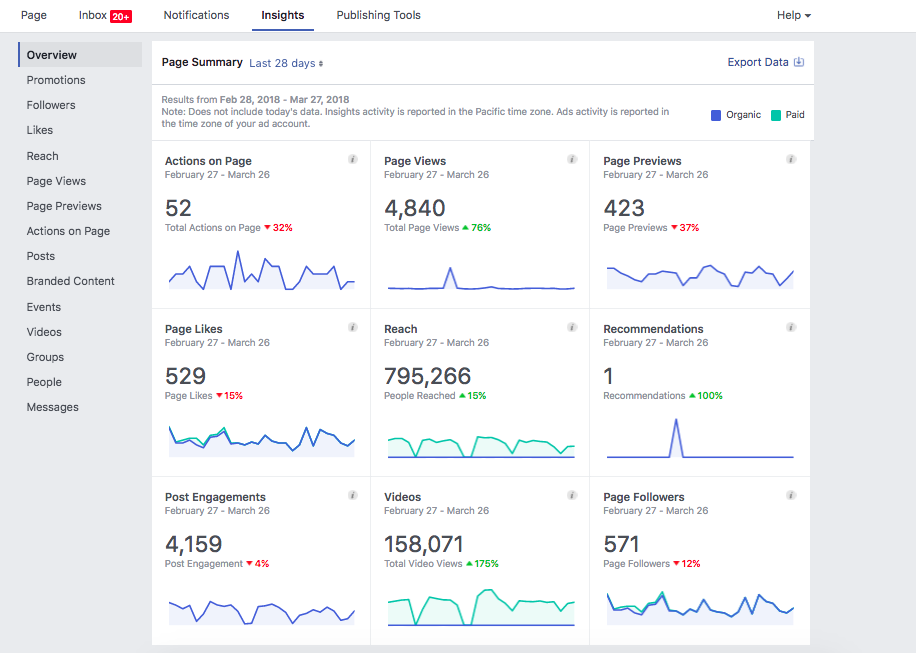
Overview Tab
The overview starts with your Page’s main data points.

This includes the following metrics:
- Page Likes: Total Page Likes is the number of unique people who like your Page. New Page Likes shows the number of new Likes your Page received during the last seven days, compared with the previous seven-day period.
- Post Reach: Total Reach is the number of unique people who have seen any content associated with your Page, including ads, during the last seven days. Post Reach shows the number of unique people who have seen your Page posts.
- Engagement: People Engaged is the number of unique people who have clicked, Liked, commented on or shared your posts during the last seven days.
Next, you will see an overview of the social media engagement metrics for the last five posts on your Facebook Page.
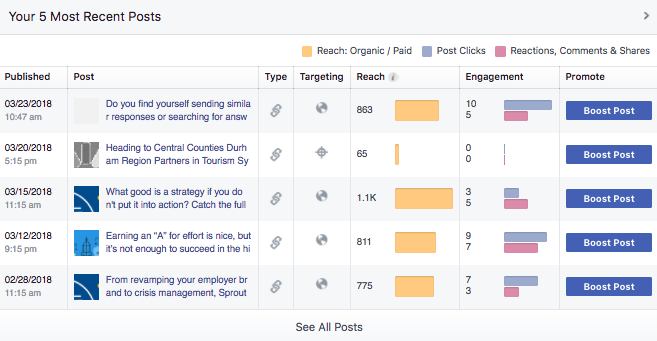
These metrics include the following:
- Reach: Post reach is the number of people who have seen your post. Your post counts as reaching someone when it’s shown in the News Feed. Figures are for the first 28 days after a post was created and include people viewing your post on desktop and mobile.
- Engagement: People engaged is the number of unique people who’ve clicked, Liked, commented on or shared a post on your Page. In the Overview section of your Page Insights, you can see People Engaged for the last seven days.
At the bottom of the Overview page, you will find metrics for Pages you watch, such as your competitor’s Facebook Pages.

Here, you can see the following weekly metrics on your competitors:
- Total Page Likes
- Number of new posts
- Engagement
Likes Tab
The Likes tab gives you detailed metrics on trends for your net Likes.

Your net Likes combines the following metrics:
- Unlikes: Number of people who have unliked your Page.
- Organic Likes: Number of people who have Liked your Page, not as a result of a Facebook Ad campaign.
- Paid Likes: Number of people who have Liked your Page as a result of a Facebook Ad campaign.
- Net Likes: The number of new Likes minus the number of unlikes on your page.
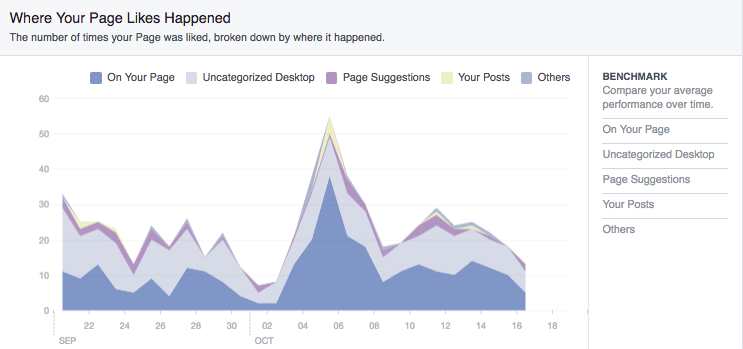
Beneath that, you will find a chart showing the source of your Likes. Included are the number of Likes you receive on your Facebook Page itself, from related Page suggestions on other Pages, posts that other people make on your Page and Likes from mobile users.
Reach Tab
On the Reach tab, you can review two different sets of metrics that affect your reach. After a graph showing your overall organic versus paid reach, you will see a graph showing your overall post Likes, comments and shares. This chart is extremely helpful to monitor because if these metrics increase, you will reach more people organically.

Next, you will see how many times people on Facebook hide your post, report posts as spam or unlike your Page. If these metrics increase, you will reach less people organically. It’s also a sign that your audience is not connecting or resonating with the content you’re sharing. Check out these tips to build an engaged audience on social.

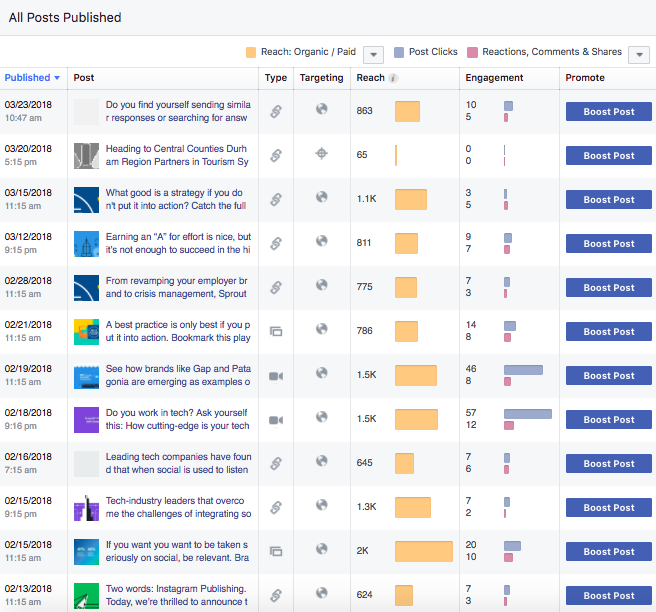
Posts Tab
On the Posts tab, you will see detailed metrics for your individual Facebook Page posts. By default you will start by viewing your post’s organic versus paid reach and the post clicks, Likes, comments and shares. Note that the Post Clicks metric means any click on your Facebook post itself and not just clicks from your post to a website link.
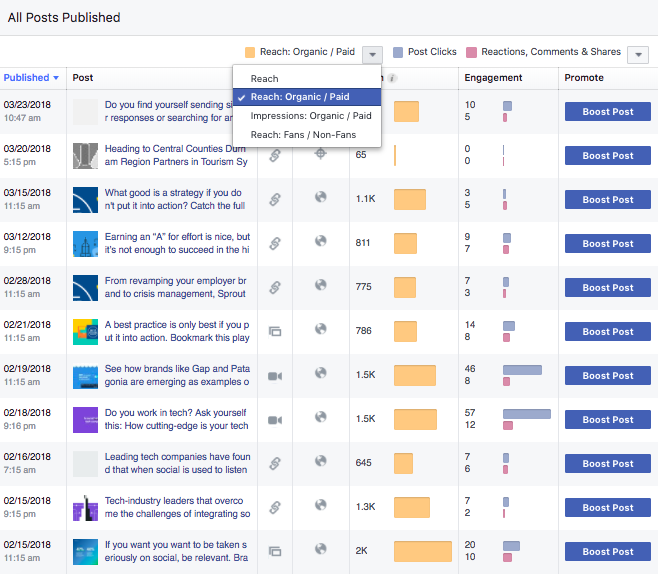
You can use the first drop-down to switch from seeing your organic versus paid reach to organic versus paid impressions. Note the difference in the reach versus impressions metrics.
- Impressions: The number of times a post from your Page is displayed, whether the post is clicked or not. People may see multiple impressions of the same post. For example, someone might see a Page update in News Feed once, and then a second time if their friend shares it.
- Reach: The number of people who received impressions of a Page post. Reach might be less than impressions since one person can see multiple impressions.
You can use the second drop-down to switch from seeing post clicks, Likes, comments and shares to seeing only Likes, comments and shares; post hides, spam reports and unlikes; or engagement rate percentage. The latter is defined as follows.
- Engagement Rate Percentage: Engagement rate is the percentage of people who saw a post that Liked, shared, clicked or commented on it.
People Tab
On the People tab, you will find a breakdown of demographic metrics for your fans, the people you’ve reached with your Page posts and the people who have engaged with your Page posts. This information can be utilized to ensure that you are getting the right fans for your business and to help create better content for your audience.

Facebook also lets you export additional data about your Page, posts and uploaded videos. This gives you raw data about your Page’s activity, and each metric is defined within the spreadsheet.
Facebook Video Metrics
If you publish videos to Facebook, you’ll have access to in-depth video metrics.
- Total views: The total number of people who saw your video(s). Views are also broken down by the duration of your videos people watched—10 seconds, 30 seconds or 95%. Plus, you can see how many of the views were auto play, click to play or viewed with the sound on.

- Average completion percent: The average amount of time people watch your videos. Audience retention is important because it gives insights into how engaging and captivating your videos are. If you’re not holding their attention for very long, you may need to make changes to the videos you’re creating and sharing.

- Peak live viewers: The highest number of viewers you had during a Facebook Live stream. Your peak viewership time can help you plan for the best time to host future live streams.

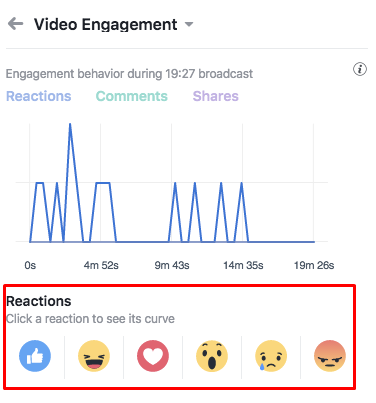
- Video engagement: The number and types of engagement your videos receive. Knowing the number of people who viewed your videos is nice. But did the viewers actually enjoy your content? Keep tabs of your video engagement metrics to gauge how well received your videos and live streams are to users.
For those who would prefer a cleaner summary of their Facebook Insights, Sprout Social provides one simple report for Facebook analytics. With our report, you can see key social media metrics like the overall Page Likes, impressions and demographics of any page you manage.

You can also see details on how your content is performing and how people engage with specific posts on your Facebook Page.

This gives you the vital information you need about your Facebook Page in one report, versus navigating through multiple tabs.
Twitter Analytics
While not as detailed as Facebook, Twitter offers its own analytics for all account users. When you arrive at your analytics dashboard, you will be greeted by a 28-day summary of metrics and highlights for your activity by month.

Included are the following metrics.
- Tweets: The number of Tweets you’ve posted to your account.
- Tweet Impressions: The number of people that have seen your Tweets have been seen by.
- Profile Visits: The number of people who have visited your profile.
- Mentions: The number of times your username has been mentioned by others.
- Followers: The number of followers on your Twitter account.
- Tweets Linking to you: The number of Tweets attributed to you in Twitter Cards with URLs.
On the Tweets tab, you will see a 28-day summary of metrics for the Tweets you’ve shared.
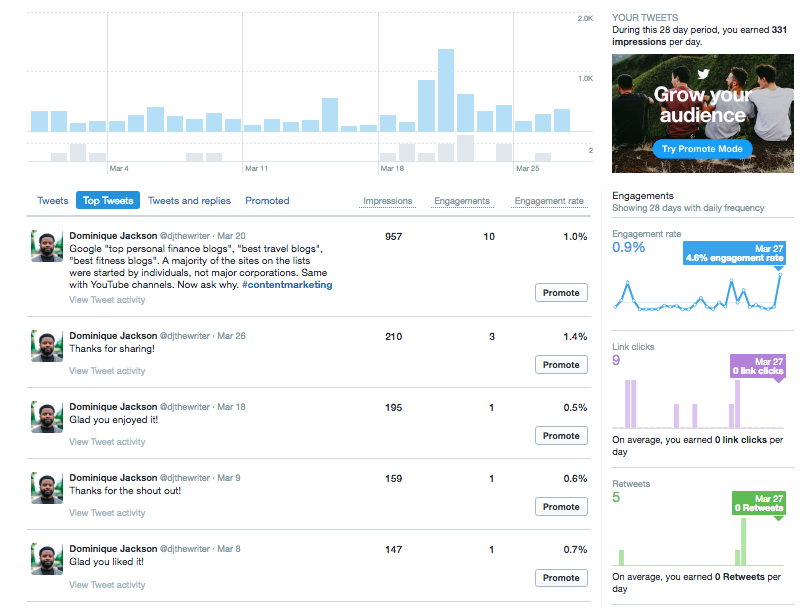
These metrics include the following.
- Engagement Rate: The number of total link clicks, Retweets, favorites and replies your Tweets receive divided by the number of impressions.
- Link Clicks: The number of times links within your Tweets were clicked. This includes links to hashtags and other users mentioned in your Tweets.
- Retweets: The number of times your Tweets were retweeted by others.
- Favorites: The number of times your Tweets were favorited by others.
- Replies: The number of times people replied to your Tweets.
You can click on any Tweet on this screen to see more detailed metrics.

On the Audience tab, you will get a detailed breakdown of demographics, organized by:
- Lifestyle
- Consumer behavior
- Mobile footprint

For those who would prefer a simpler summary of their Twitter analytics, Sprout Social provides one easy-to-digest report. In a quick glance, you can see all of your main metrics such as impressions, engagement, link clicks and more.

You can see demographic data as well.

The Twitter keyword report gives you additional data on conversations going on about your brand, so you can measure your share of voice.

Instagram Analytics
In the early days, businesses had very limited insights into how their Instagram posts performed. But with the introduction of Instagram Insights and Sprout’s Instagram management tools, you now have a lot of helpful information at your disposal.
If you switch from a personal account to an Instagram business profile, you’ll be able to see an overview of your posts’ performance and demographic information about your audience.
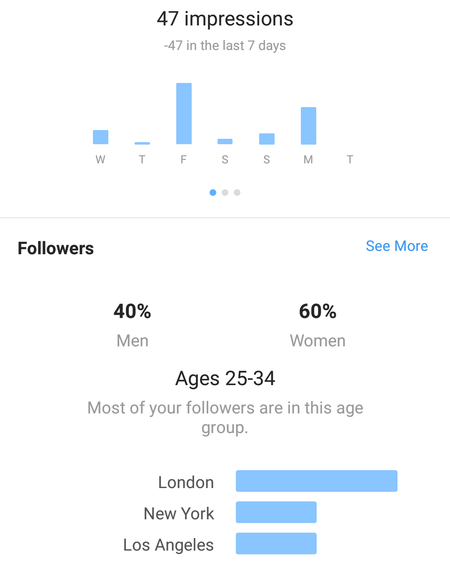
- Impressions: The total number of times your posts have been seen.
- Reach: The number of unique accounts that have seen your posts
- Profile views: The number of times your profile was viewed.
- Engagement: The number of likes and comments on your posts.
- Saved: The number of unique accounts that saved your posts.
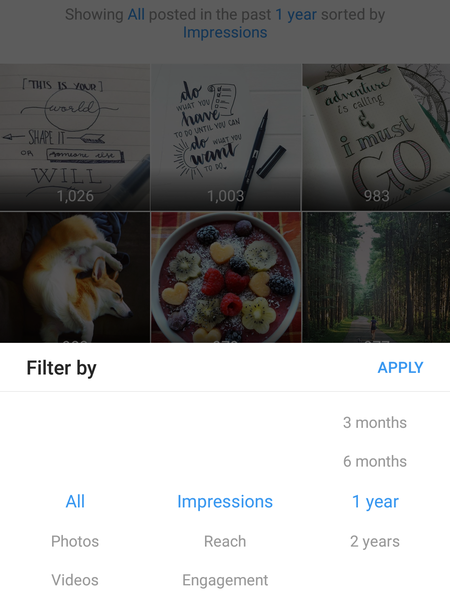
Instagram Insights gives you a “top posts” section where you can see your best performing posts sorted by these specific metrics.
For even more data, you can use Sprout’s Instagram analytics dashboard. With this report, you can see your post performance and follower growth for multiple profiles in a single dashboard. Plus, the reports are presentation-ready in case you need to show them to clients or other team members.

In addition to looking at your individual posts, we also included hashtag reporting. Since hashtags are such an important part of your Instagram marketing strategy, you need to track which ones perform the best.

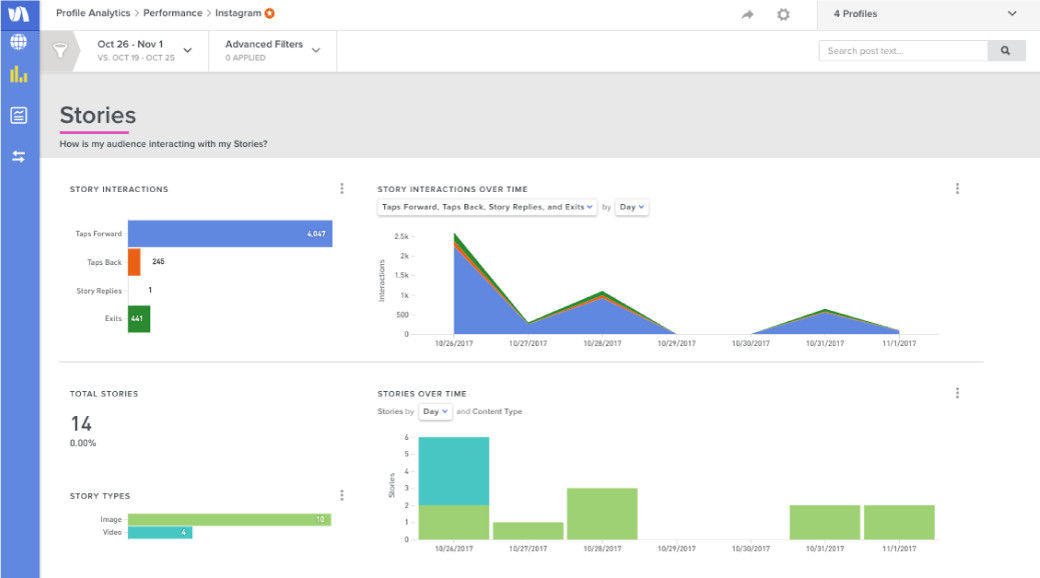
Want to know how your Instagram Stories are performing? Use our advanced analytics from Simply Measured to get insights into how people engage with your Stories. See metrics like:
- Taps forward
- Taps back
- Story replies
- Exits
Between Instagram Insights and Sprout’s suite of analytics, you have plenty of data to use for planning out new content and spotting Instagram trends in your past posts.
LinkedIn Analytics
When you visit your LinkedIn Company Page you can click on the Analytics tab to learn more about your post performance and audience. First, you will see metrics for individual posts made by your Company Page.
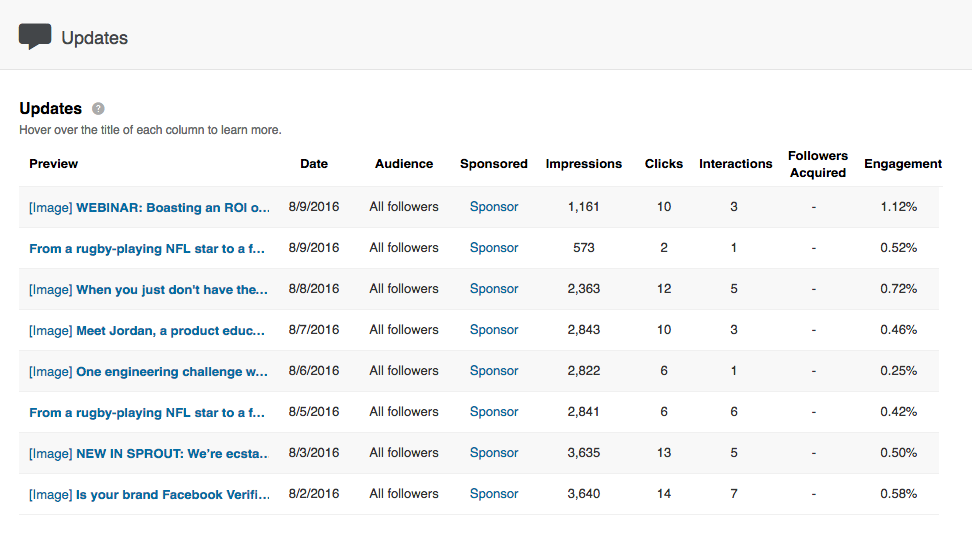
These metrics include the following.
- Impressions: The number of times the update was shown to LinkedIn members.
- Clicks: The number of clicks on your content, company name or logo.
- Interactions: The number of likes, comments and shares on your update.
- Followers: The number of followers you acquired when sponsoring an update.
- Engagement: The number of interactions divided by number of impressions.
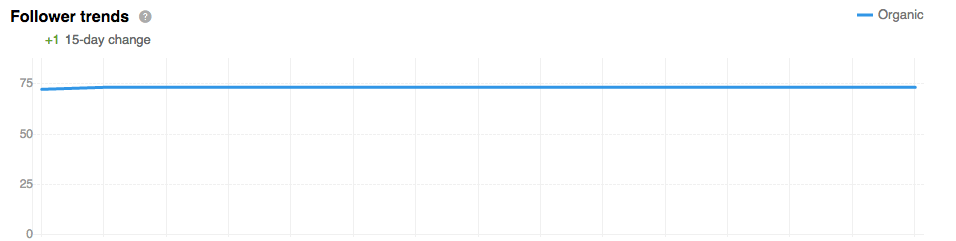
Next, you will see information about your followers and how you compare to similar companies.
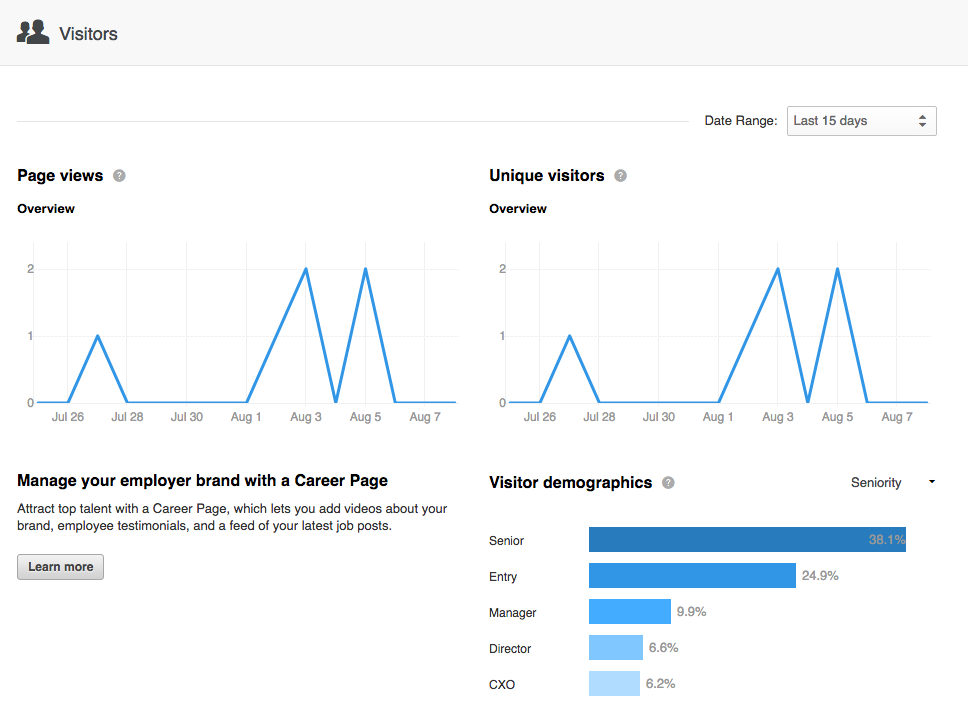
Finally, you’ll see metrics for your page views, unique visitors and visitor demographics. Use the drop-down to switch between seniority, industry, company size and function.
To keep all your social media metrics in one place, you can use Sprout’s LinkedIn Company Pages report. Our analytics lets you measure the performance of your posts, get demographics on your audience and more. Like our other reports, everything is neatly organized into a single page.

Pinterest Analytics
If you have a Pinterest business account, you can access Pinterest analytics to learn more about your profile activity, audience and Pins. You will start on the Overview screen where you can see key metrics for your profile, audience, activity from your domain and most popular Pins.
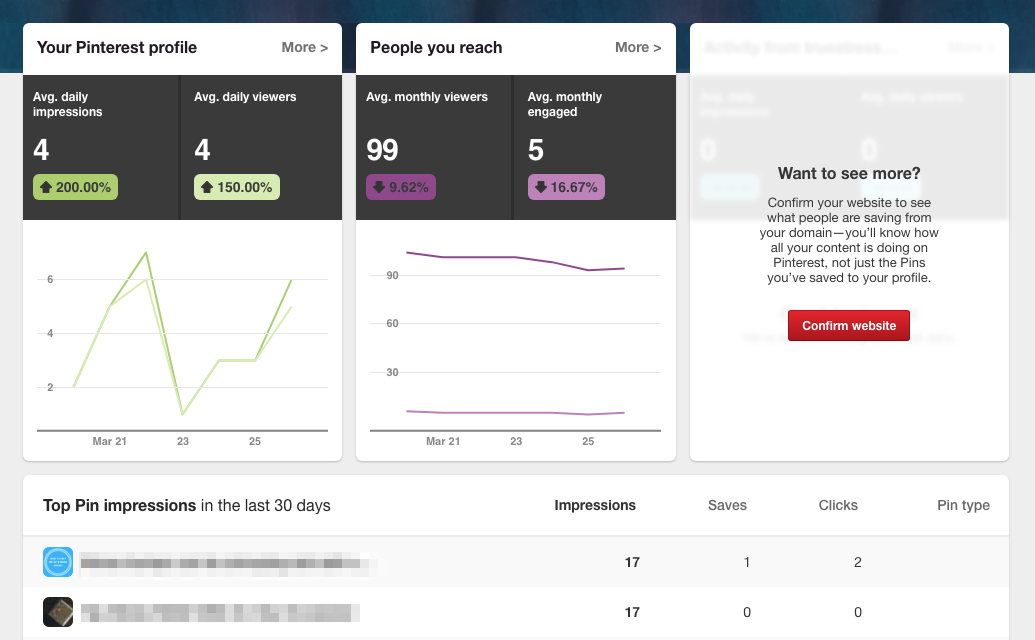
In the Your Pinterest Profile section, you will see detailed metrics for your profile’s impressions, daily viewers and Pins. You can use the tabs at the top of the report to see top Pins based on number of impressions, Repins, clicks and all-time favorites.

In the Your Audience section, you can see metrics for your average monthly viewers, average monthly engaged and specific demographics and interests.

In the Activity from your domain section, you can see pinning activity from the website you have verified for your page using the Pin It button. You can use the tabs at the top to see top pins from your domain based on impressions, repins, clicks and all-time favorites.

Google+ Insights
Google+ does not offer many metrics for its Pages. On your main dashboard, you’ll find an overview of your most important metrics.
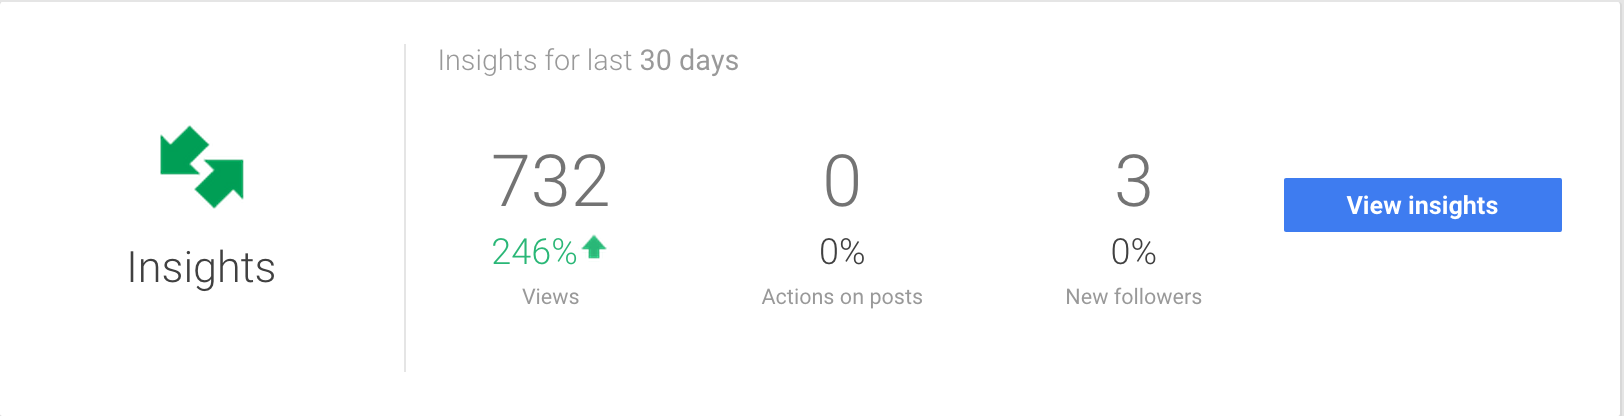
If you click “View insights,” you will find three sections of data. The first is the Visibility section.

Here, you’ll see your total views, broken down by:
- Pageviews
- Post views
- Photo views
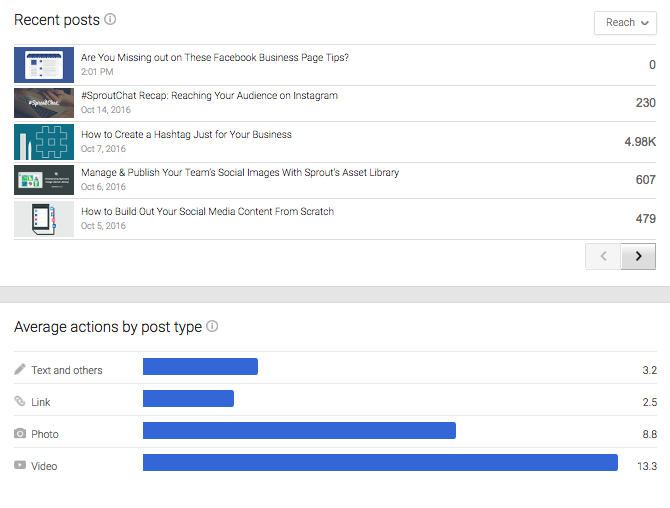
In the Engagement section, you will see metrics about the posts to your Google+ page. These include total actions, +1’s, comments and shares. Beneath the detailed metrics for your posts, you will see average actions by post type.
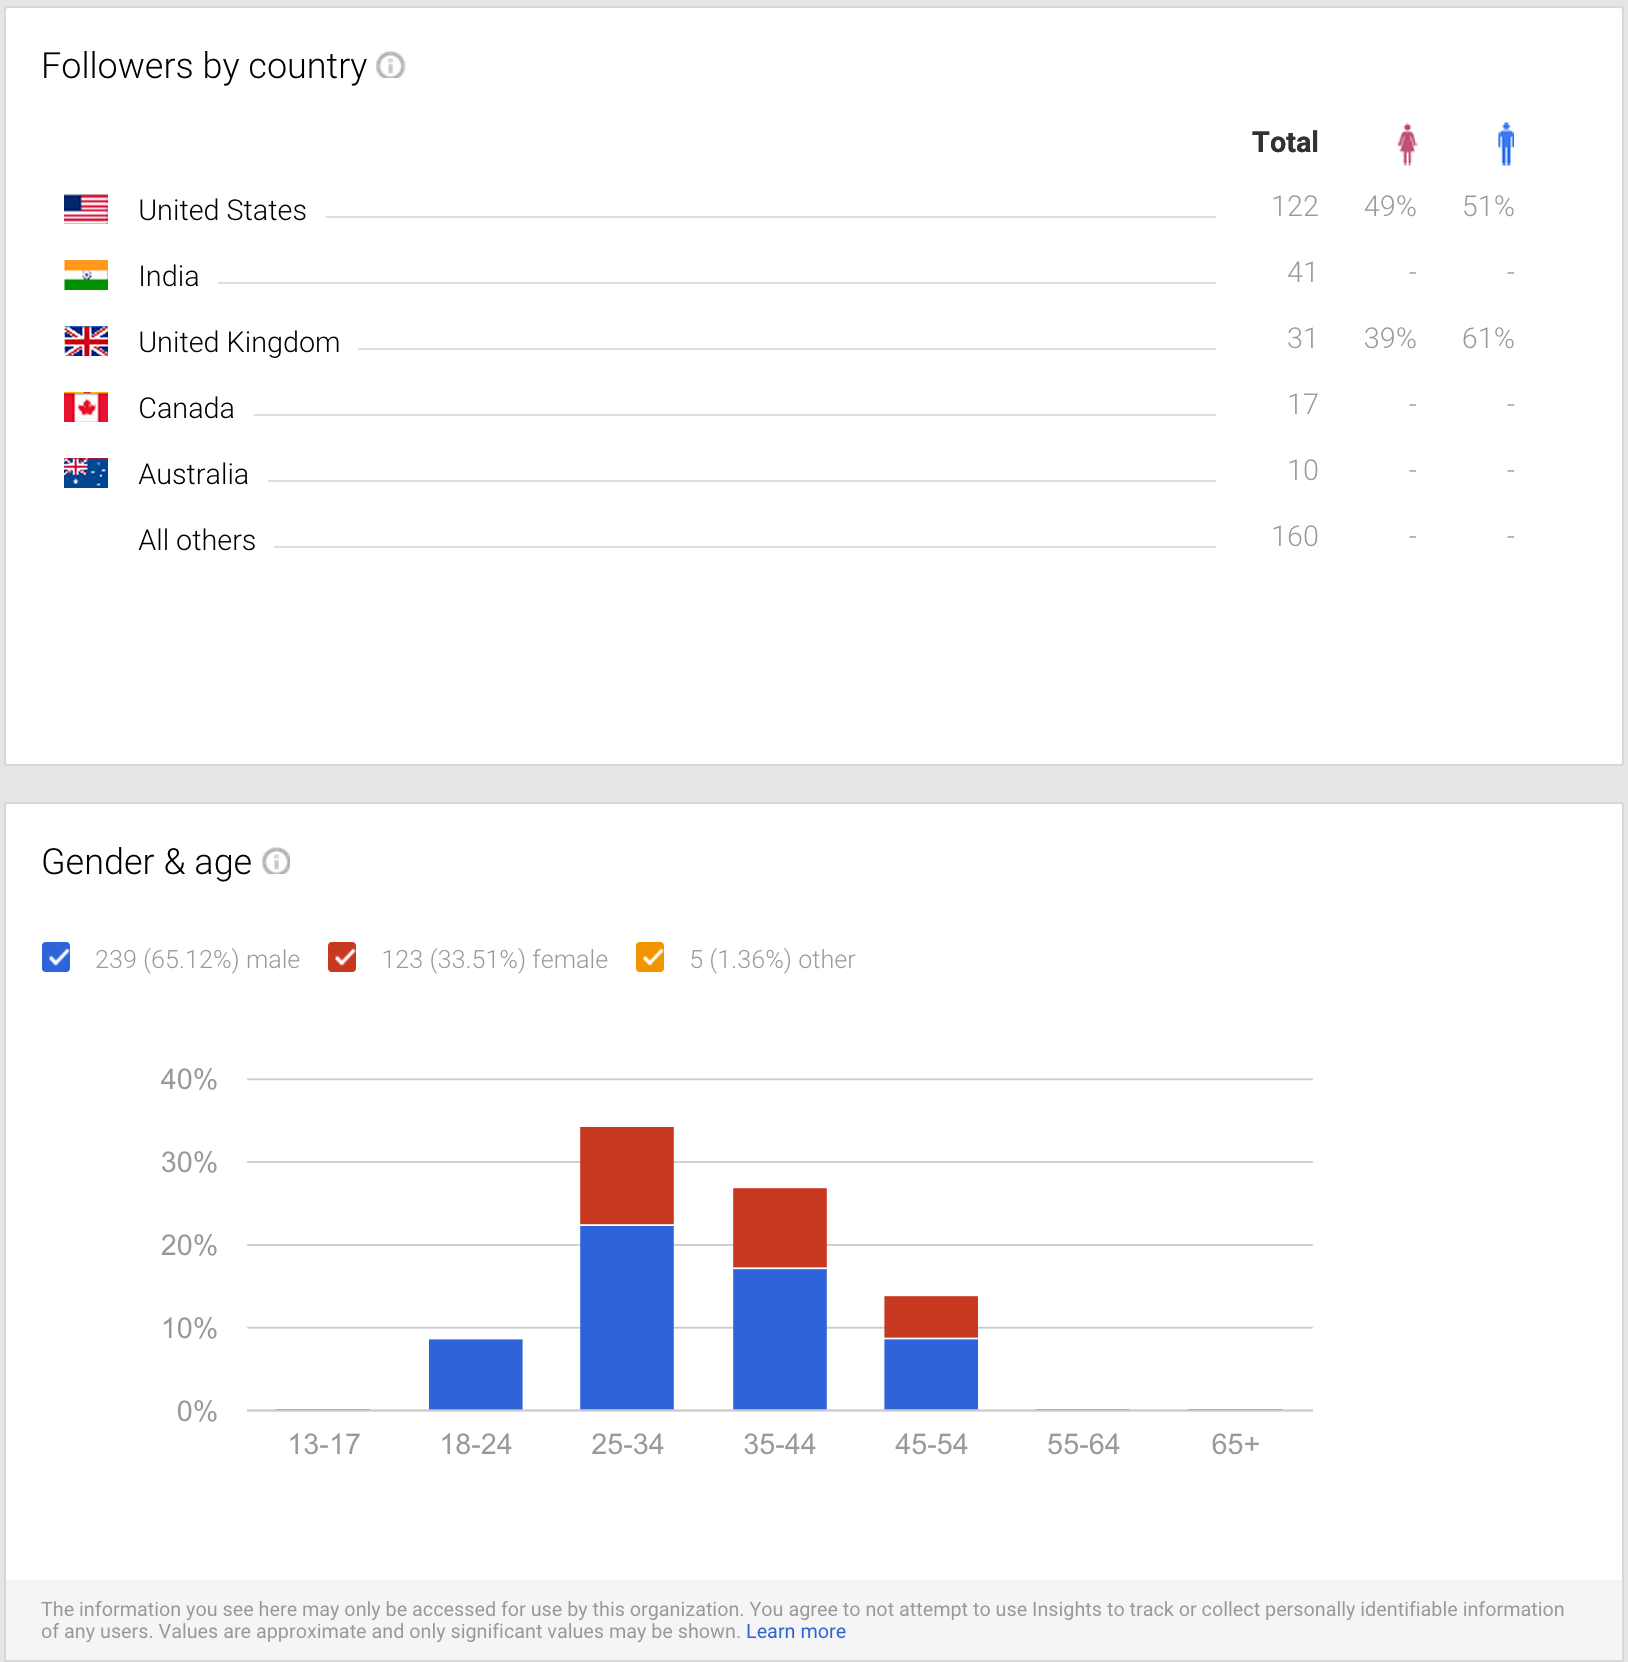
In the Audience section, you get a quick demographics overview of your Page followers.
Google Analytics Metrics for Social Media
Now that you know what kind of metrics you can get out of the top social media networks, let’s discuss the most crucial metrics for your business.
Using Google Analytics goals, you can learn more about conversions on your website, such as:
- Product sales
- Lead submissions
- Email subscriptions
Combine your goals with the built-in social media reports within Google Analytics to find out which social networks are best for your business.
Under the Acquisition section, you’ll find a few useful social media reports that show which social networks drive traffic and customers to your website.

Under Social Referrals, you will get a more detailed breakdown of the following metrics based on social network referral traffic.

The metrics here include:
- Sessions: The periods of time when a user is active on your website.
- Pageviews: Instances of a page being loaded (or reloaded) in a browser.
- Avg. Session Duration: The average length of sessions on your website.
- Pages / Session: The average number of pages viewed per session.
In the Social Conversions report, you’ll see which networks lead to conversions on your website, along with dollar values. The dollar value is only visible if you set your Google Analytics goal up with a specific dollar value per conversion.
Analyzing your social media performance metrics and statistics is important for every business. These reports can help you determine where to focus your energy when it comes to specific social media networks. More than tracking followers and engagement, they will show you which networks ultimately help your bottom line.
Try Sprout’s social media analytics dashboard to have all of your social media metrics in one location.
This post All of the Social Media Metrics That Matter originally appeared on Sprout Social.
Powered by WPeMatico